Analytics
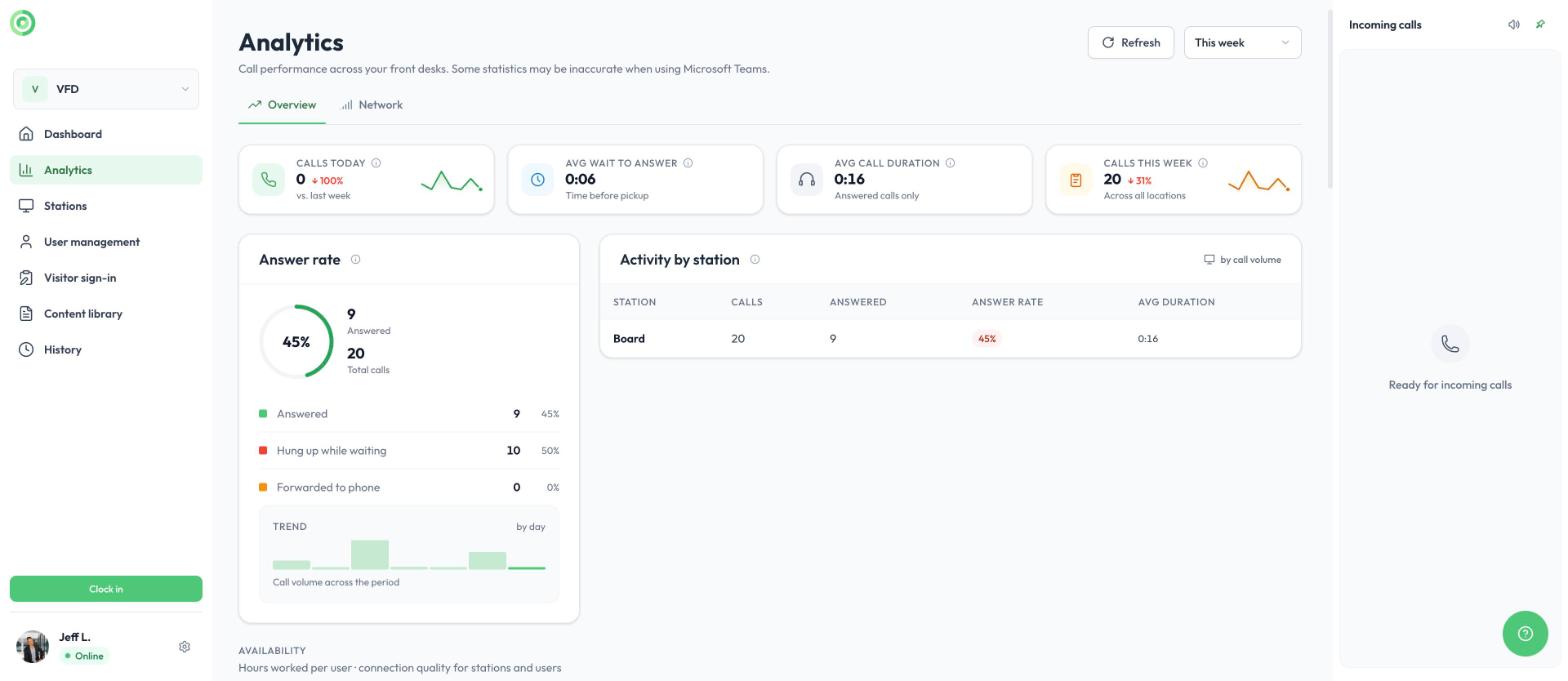
The Analytics page shows how your stations and users perform over the period you choose. Click Analytics in the main menu to open it. The page has two tabs: Overview and Network.
Use the period menu at the top right, for example This week, to choose the time range, and click Refresh to update the figures.
Note: as the page indicates, some statistics may be inaccurate for calls answered in Microsoft Teams.
Overview tab
Call statistics
- Calls today: the number of calls today, compared with the same day last week.
- Avg wait to answer: the average time before a call is picked up.
- Avg call duration: the average length of answered calls.
- Calls this week: calls across all locations, compared with last week.
Answer rate
The share of calls answered during the period, with the breakdown of every call:
- Answered: a user picked up the call.
- Hung up while waiting: the visitor left before anyone answered.
- Forwarded to phone: nobody answered the video call, so it went to a forwarding number.
The Trend chart shows the call volume for each day of the period.
Tip: many calls hung up while waiting usually means visitors are waiting too long. Add users to the group, use a call queue, or set up call forwarding so no visitor is left waiting. To learn more, read Groups and call queue and Phone calls and call forwarding.
Activity by station
Calls, answered calls, answer rate and average call duration for each station, sorted by call volume. Use it to see which lobbies are busiest and which stations miss the most calls.
Availability
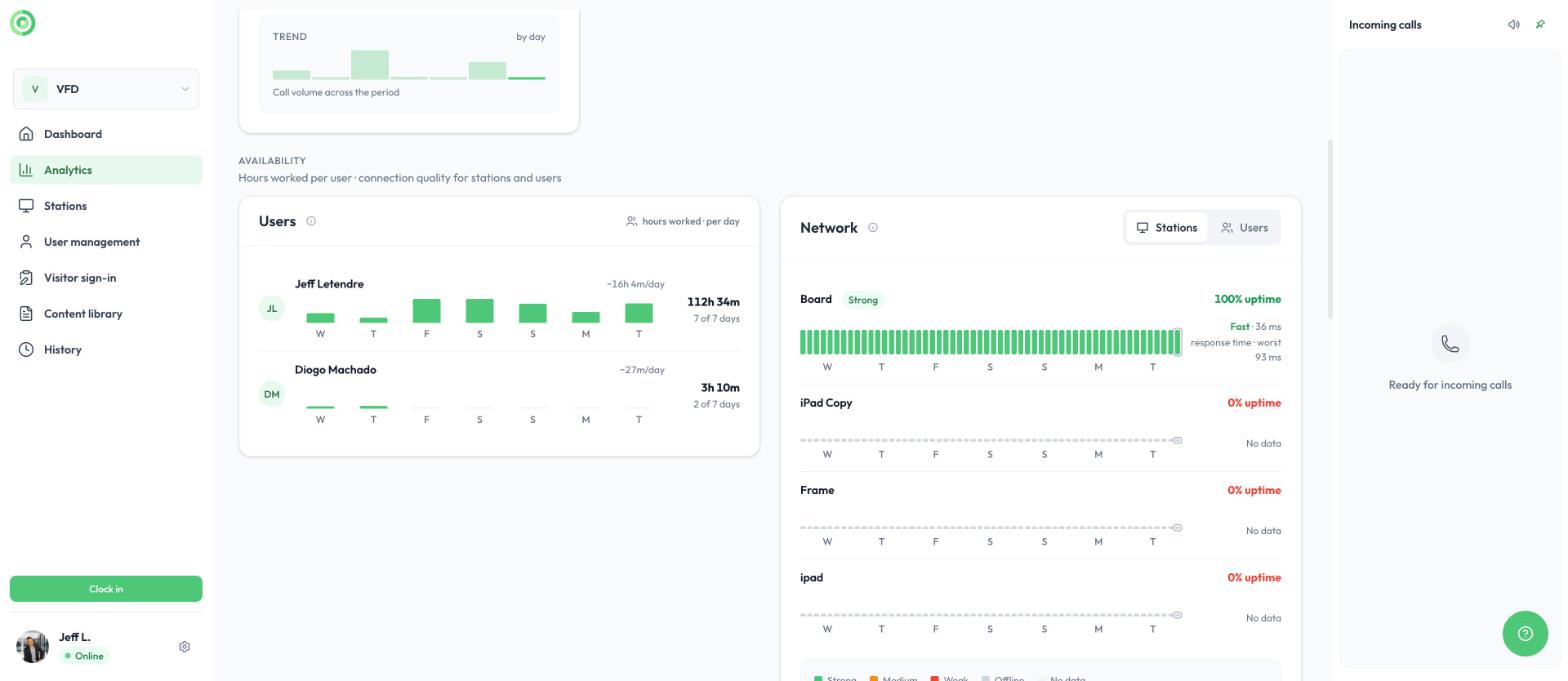
- Users: the hours each user was online in the dashboard, day by day, with the total for the period and the number of days worked.
- Network: the uptime and connection quality of each station, day by day. Use the toggle at the top right of the card to switch between stations and users.
Answered calls and satisfaction by user
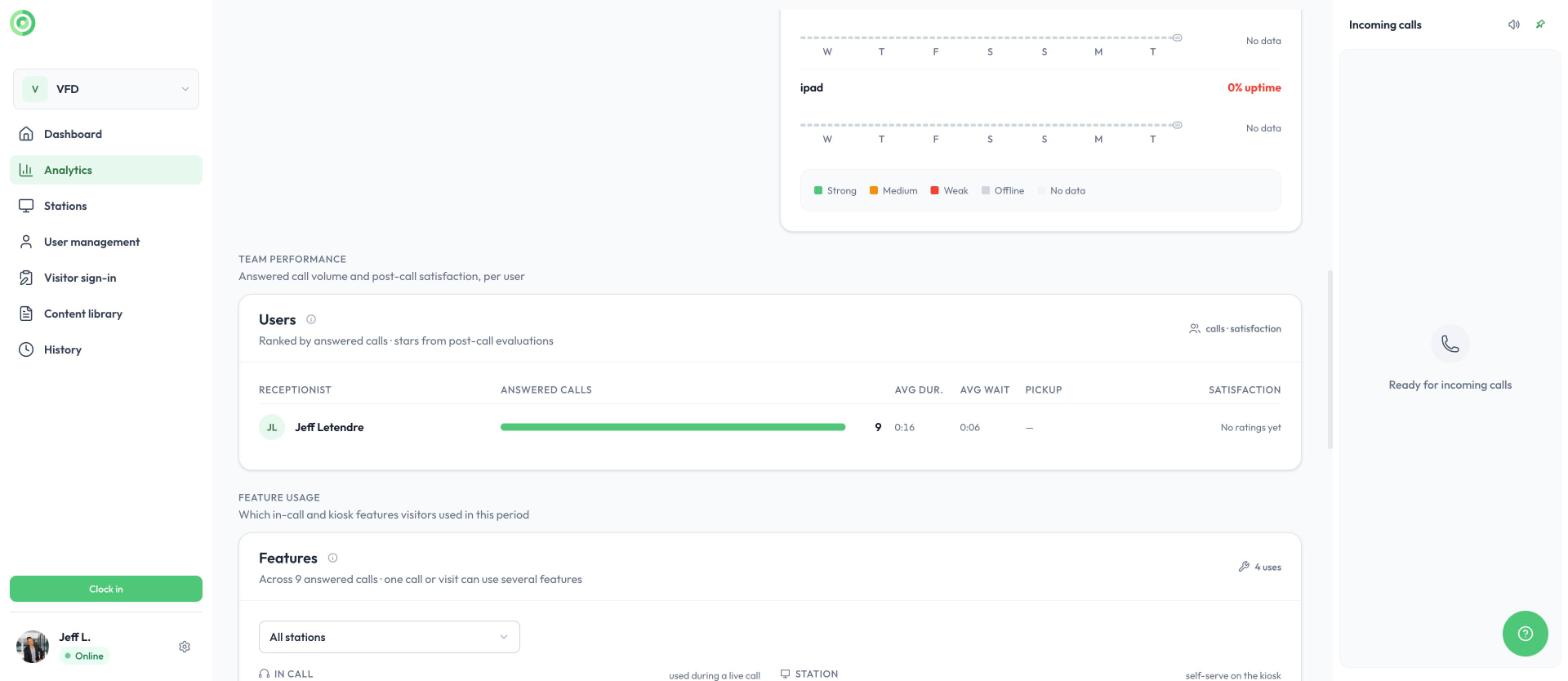
Users are ranked by the number of calls they answered, with their average call duration, average wait, pickup and satisfaction.
Satisfaction comes from the star reviews visitors leave at the end of a call. To collect them, an administrator turns on Star review under Settings > Organization > Features. Until visitors rate their calls, the column shows No ratings yet. To learn more, read Settings Menu.
Feature usage
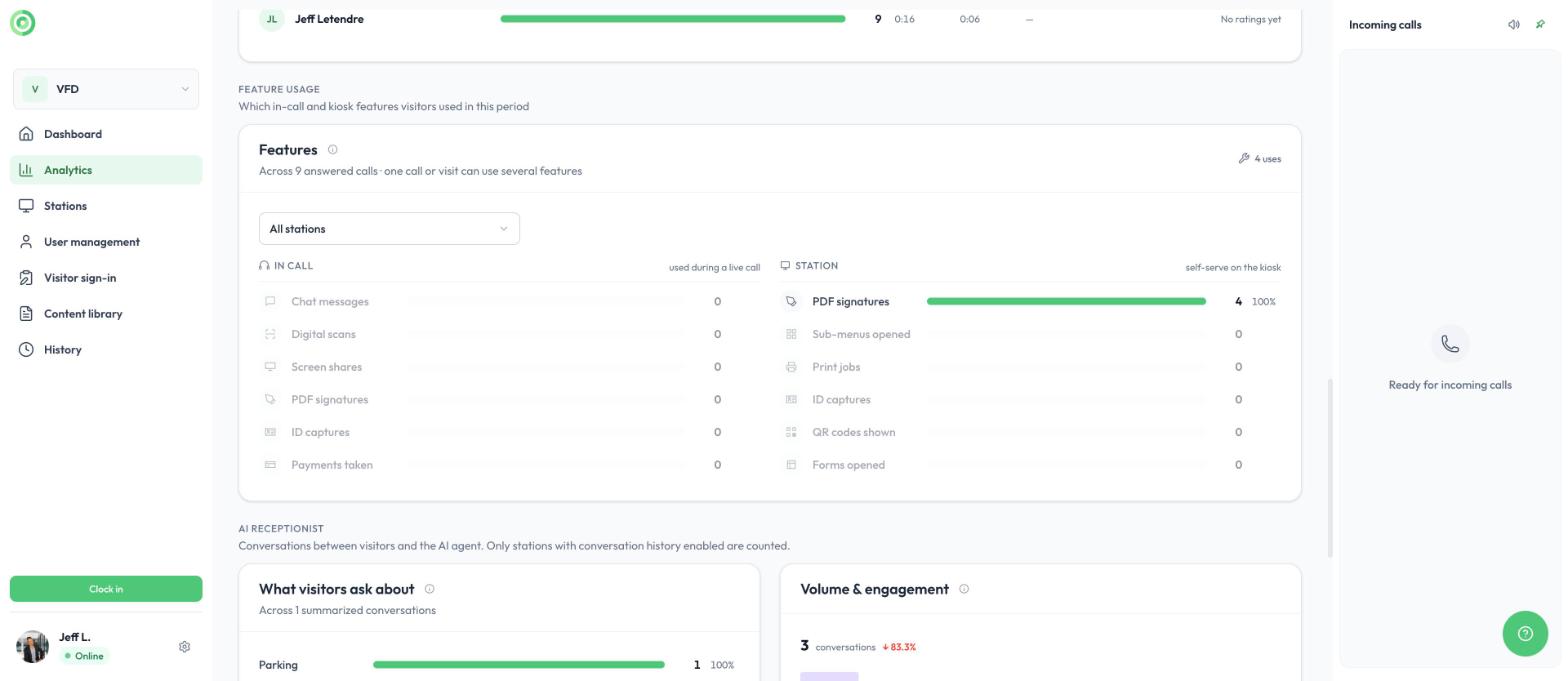
The features visitors used during the period. One call or visit can use several features. Use the station menu to see all stations or a single one.
- In call (used during a live call): chat messages, digital scans, screen shares, PDF signatures, ID captures and payments taken.
- Station (self-serve on the station): PDF signatures, sub-menus opened, print jobs, ID captures, QR codes shown and forms opened.
AI receptionist
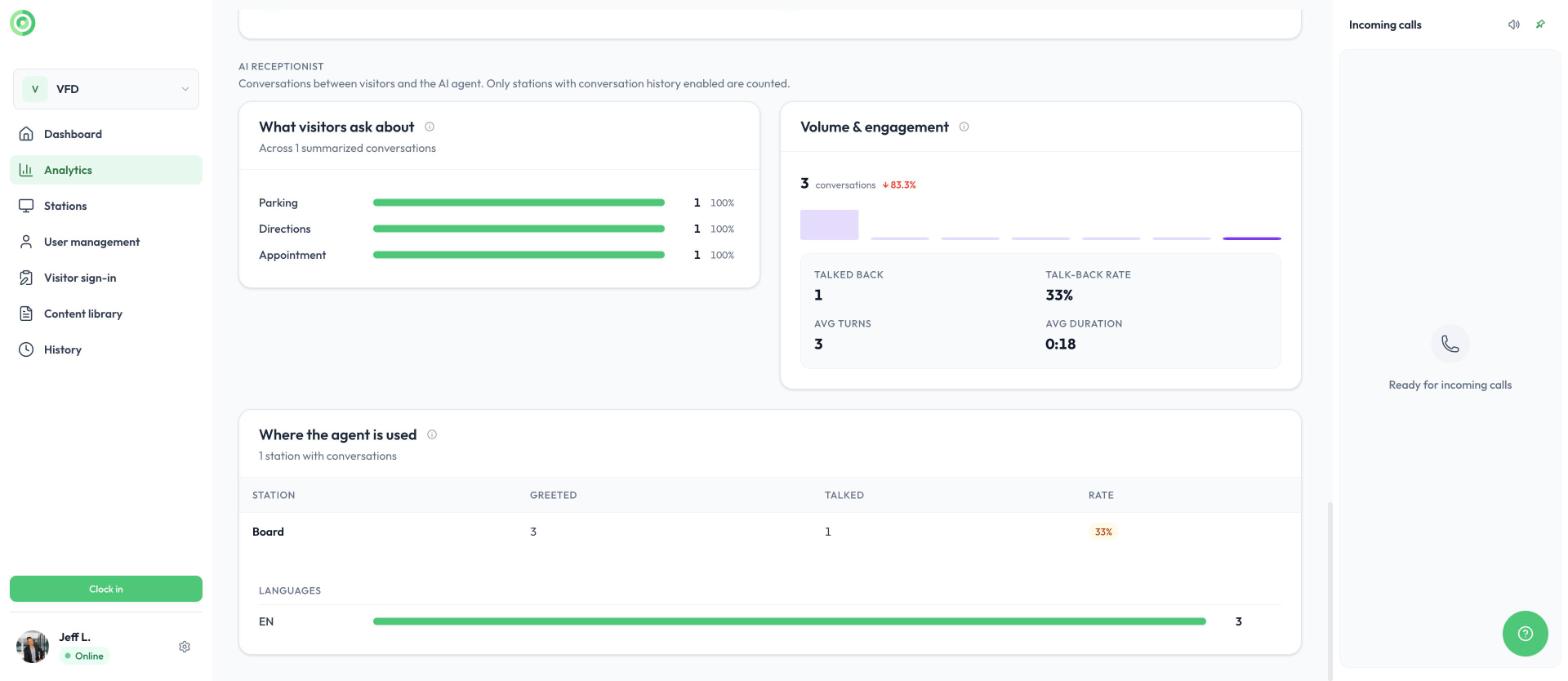
Conversations between visitors and the AI agent. Only stations with conversation history enabled are counted.
- What visitors ask about: the most common topics, such as parking, directions or appointments.
- Volume and engagement: the number of conversations, how many visitors talked back to the agent, the talk-back rate, the average number of turns and the average duration.
- Where the agent is used: for each station, how many visitors the agent greeted and how many talked back.
- Languages: the languages visitors spoke.
To read the full conversations, go to History > AI conversations. To set up the agent, read the AI Agent Setup Guide.
Network tab
The Network tab shows the connection health of your stations and users, so you can spot a problem before a visitor does.
- Fleet uptime: the share of time your stations were online during the period.
- Avg response time: how quickly your stations respond, in milliseconds. Lower is better.
- Need attention: the stations that are offline or have a weak connection.
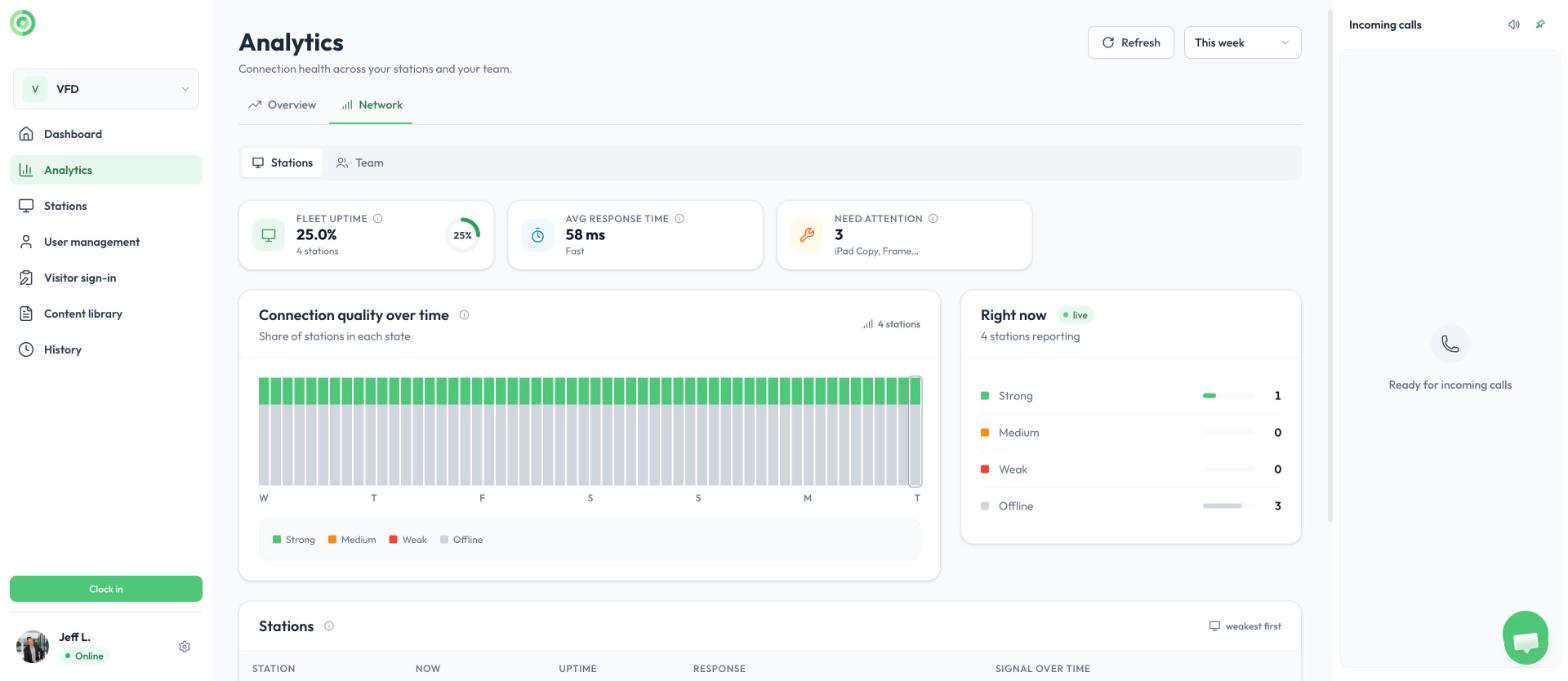
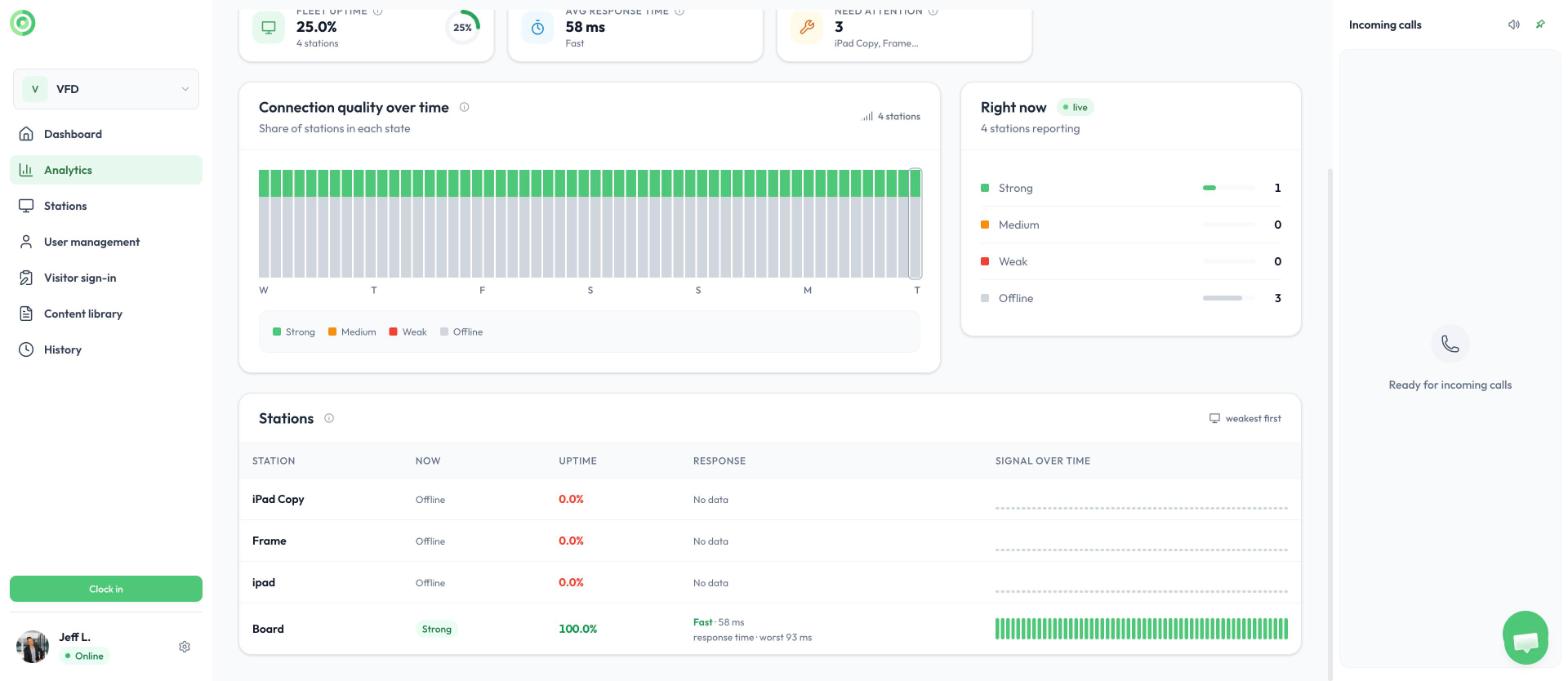
Connection quality over time shows the share of stations in each state, day by day, and Right now shows the live count. The table below lists every station, weakest first, with its current state, uptime, response time and signal over time. Use the toggle to see the connection quality of your users instead.
Connection states
- Strong: the connection is good and calls should run smoothly.
- Medium: the connection works, but video quality may drop at times.
- Weak: calls may freeze, lag or disconnect.
- Offline: the station is not connected and cannot receive or place calls.
- No data: the station did not report during the period, for example because it was never turned on.
When a station needs attention
- Check that the device is turned on, plugged in and not asleep.
- Check that the station page is open in the device's browser.
- Check the internet connection. A wired connection is more reliable than Wi-Fi.
- Reload the station with the refresh icon next to it on the Dashboard home page or in Stations.
- If the problem continues, ask your IT department to allow the network access listed in the Troubleshooting guide, Firewall, Permissions.
Good to know: billing is per activated station, including stations that are offline. Delete the stations you no longer use. To learn more, read Creating Stations.
Need more help?
Please contact us through the live chat.