Dashboard overview
Dashboard overview
The dashboard is the web app where you set up Virtual Front Desk and answer your visitors. It runs in your browser at app.virtualfrontdesk.com (or your region’s address), so there is nothing to install. This article gives you a quick tour, so you know where everything is.
What you see depends on your role: owners, administrators and managers see every section, while users see the sections they need to answer calls. To learn more, read Organizations, owner, admin and regular users.
The Dashboard home page
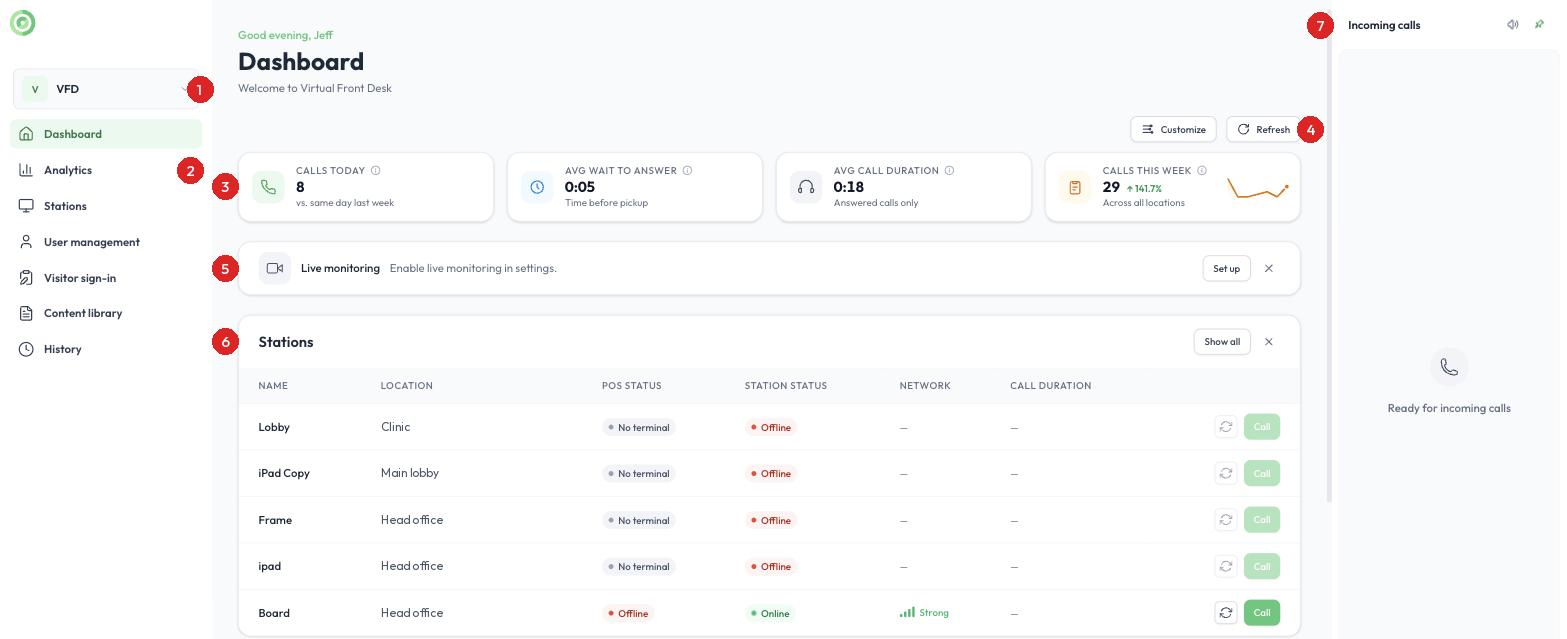
When you sign in, the Dashboard home page gives you a live view of your front desks.
The Dashboard home page
- Organization menu: shows the organization you are working in. Click it to switch to another organization, open Organization settings or create a new organization.
- Main menu: takes you to every section of the dashboard. See The main menu below.
- Call statistics: calls today, average wait before a call is answered, average call duration and calls this week. Click the information icon on a card to see what it measures.
- Customize and Refresh: click Customize to choose which sections appear on your home page (Live monitoring, Stations, Users and Printers), or Refresh to update the statistics. You can also hide a section with its X button.
- Live monitoring: watch a live camera feed from your stations, so you can keep an eye on your lobbies and start a video call as soon as you see a visitor who needs help. Up to four feeds are shown at the same time. Click Set up to choose which stations to monitor. Live monitoring is available on the Enterprise plan. To learn more, read Monitoring or live streaming your stations.
- Stations, Users and Printers: see the status of your stations at a glance, including whether each station and its payment terminal are online and the strength of its network. Click Call to start a video call with a station, or the refresh icon to reload it. The Users and Printers sections below show who is online and which locations have a printer connected.
- Incoming calls: visitor calls appear in this panel. Use the speaker icon to mute the ringtone, and the pin icon to show calls as notifications instead of a panel that stays open.
The main menu
- Dashboard: your home page, described above.
- Analytics: call performance across your front desks, such as answer rate, activity by station, hours worked by users and network quality, for the period you choose.
- Stations: create and manage your stations, brand the welcome screen and add buttons. To learn more, read Creating Stations.
- User management: invite users, choose their roles and create groups. To learn more, read Users and Groups and call queue.
- Visitor sign-in: build your sign-in forms and invite visitors ahead of time. To learn more, read Visitor sign in, sign out and Express QR code sign in.
- Content library: the PDFs, QR codes, websites and online forms your stations display, and the context files for the AI agent. To learn more, read Documents, PDFs, QR Codes & iFrames.
- History: call logs, sign-in logs, pre-registration logs, payment transactions and AI agent conversations. To learn more, read History.
At the bottom of the menu
- Clock in: start and end your shift. To learn more, read Clock in Clock out, Timesheets.
- Your name and status: shows whether you are online and ready to receive calls.
- Settings (gear icon): your personal settings, such as how you are notified of calls, and the organization’s settings. To learn more, read Settings Menu.
Help is always one click away
Click the Help center button at the bottom right of any page to search our tutorials or chat with us.
Tip: Keep the dashboard open in a browser tab while you work, so you never miss a visitor call. For answering calls on the go, use the iPhone, iPad and Android apps.
Need more help?
Please contact us through the live chat.